
Technical SEO
Technical SEO
Core Web Vitals: what LCP, INP and CLS are and how to improve each one
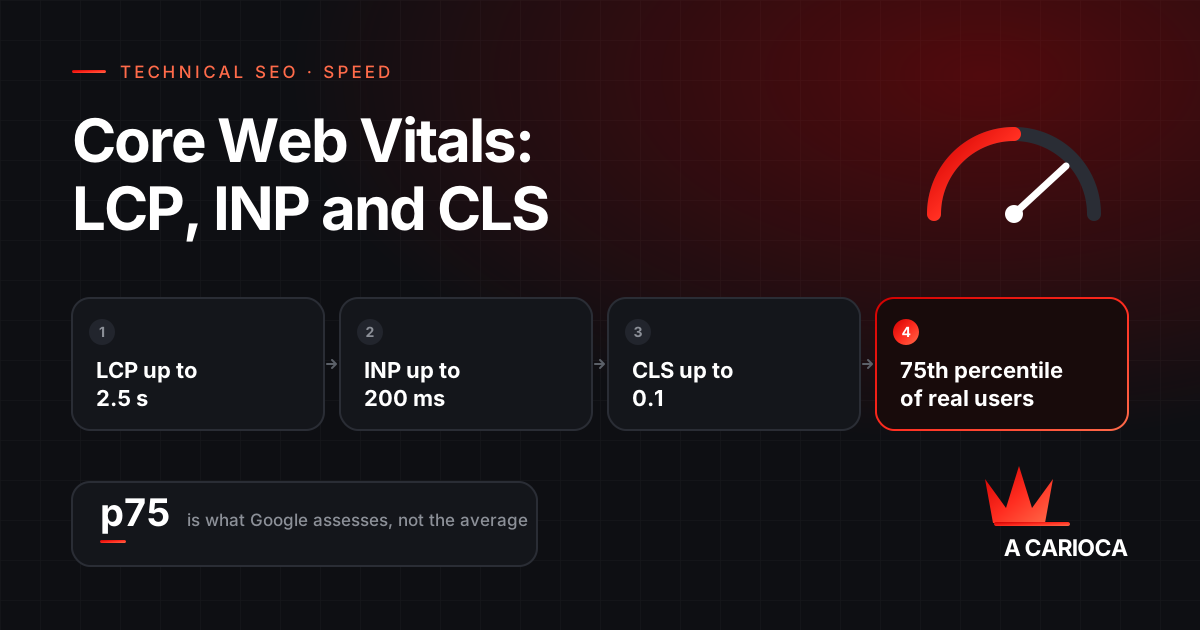
Core Web Vitals are three Google metrics measured with real users: LCP (the largest visible element loads within 2.5 s), INP (the page responds to clicks and taps within 200 ms) and CLS (content shifts no more than 0.1). Assessment uses the 75th percentile of visitors. To improve them: a fast server and a prioritised hero image for LCP, less third-party JavaScript and fewer long tasks for INP, declared image dimensions and reserved space for embeds for CLS. They weigh little in ranking and a lot in conversion.
In short
- "Good" thresholds: LCP up to 2.5 s, INP up to 200 ms, CLS up to 0.1, measured at the 75th percentile of real users.
- INP replaced FID in March 2024 and is the metric most sites fail today.
- Use the Search Console report to find failing URL groups and DevTools to find the cause.
- LCP: fast server and prioritised hero image. INP: fewer third-party scripts. CLS: declared dimensions.
- A ranking tiebreaker; the effect on conversion is bigger and more direct.
What the Core Web Vitals are and the current thresholds
Core Web Vitals are the three metrics Google uses to summarise a page's loading experience with real user data. Each measures something different, and a page must pass all three to be considered good.
| Metric | What it measures | Good | Needs improvement | Poor |
|---|---|---|---|---|
| LCP (Largest Contentful Paint) | Time until the largest visible element (image, video or text block) finishes rendering | up to 2.5 s | 2.5 s to 4 s | over 4 s |
| INP (Interaction to Next Paint) | Time between an interaction (click, tap, key) and the next visible update, taking the worst interaction of the visit | up to 200 ms | 200 ms to 500 ms | over 500 ms |
| CLS (Cumulative Layout Shift) | How much content moves on screen without the user doing anything | up to 0.1 | 0.1 to 0.25 | over 0.25 |
Assessment is done at the 75th percentile: 75% of visits must fall within the threshold. A good average is not enough; what counts is the experience of your slower visitors, who are precisely the ones on phones and mobile networks.
INP replaced FID (First Input Delay) on 12 March 2024. FID measured only the delay of the first interaction; INP measures the response to every interaction and reports the worst. That is why many sites that passed FID started failing after the switch.
Field and lab data: where to measure
There are two kinds of measurement, and confusing them is the most common cause of wrong diagnosis:
- Field (CrUX): data collected from real Chrome users who agreed to share statistics. It is what Google uses for ranking and what appears in the Search Console Core Web Vitals report and at the top of PageSpeed Insights. It only exists for pages with enough traffic.
- Lab (Lighthouse): a simulated test on a standardised device and network. Useful for diagnosing and reproducing problems, but not representative of your real user base. The 0 to 100 PageSpeed score is lab data.
| Tool | Data type | Use it to |
|---|---|---|
| Search Console, Core Web Vitals report | Field | See which groups of URLs fail, on mobile and desktop |
| PageSpeed Insights | Field (top) and lab (below) | See the real state of a URL and the likely causes |
| Chrome DevTools, Performance panel | Lab, on your machine | Find the slow interaction and the long task behind it |
| Web Vitals Chrome extension | Field, your own session | Watch the metrics live while browsing |
| web-vitals library + analytics | Field, your users | Collect metrics from every visitor and segment by page and device |
Always start with the Search Console report: it groups URLs sharing the same problem, and fixing the template fixes the whole group.
Improving LCP
The LCP element is usually a hero image, a banner or the main heading. The most frequent causes of poor LCP, in order of impact:
- Slow server (high TTFB). Nothing renders before the HTML arrives. Page caching, a CDN and adequate hosting fix most of it. A TTFB above 800 ms compromises LCP on its own.
- LCP image discovered late. Images loaded via CSS (background-image) or JavaScript are only found after the browser processes those files. Put the main image in the HTML as
<img>and flag its priority withfetchpriority="high". Never useloading="lazy"on the LCP element. - Heavy image or wrong format. Serve it at the displayed size, in WebP or AVIF, with
srcsetfor each screen width. - Render-blocking resources. CSS and JavaScript in the
<head>delay everything. Inline critical CSS, defer the rest and load scripts withdefer. - Web fonts. If the LCP element is text and the font is slow, the text appears late. Use
font-display: swapandpreloadthe main fonts.
An example of a hero image prepared for LCP:
<link rel="preload" as="image" href="/img/hero.webp" fetchpriority="high">
<img src="/img/hero.webp" width="1200" height="630" alt="..." fetchpriority="high" decoding="async">
Improving INP
INP is the hardest of the three, because it depends on what happens throughout the visit, not just at load. It gets worse when the browser's main thread is busy at the moment the user interacts. The most common causes:
- Third-party JavaScript. Chat widgets, pixels, heatmaps, review widgets and tag manager scripts all compete for the main thread. Each is small; together they are the problem. Audit what loads and remove what does not drive a decision.
- Long tasks. Any block of JavaScript over 50 ms blocks the response to clicks. Split the work into smaller pieces and yield to the browser between them (
scheduler.yield()orsetTimeout). - Heavy event handlers. A click that triggers computation, rendering and a data send at once is slow to show any response. Update the screen first and do the rest afterwards.
- Very large DOM. Pages with tens of thousands of elements make every layout update cost more. Pagination, list virtualisation and less nesting help.
- Framework hydration. On sites built with React, Vue or similar, the page can look ready and still not respond because JavaScript is "hydrating" the components. Server rendering with partial hydration reduces the problem.
To find the slow interaction: in Chrome DevTools, record a session in the Performance panel, interact with the page and look for tasks marked in red. The panel shows which script was running at the moment of the click.
Improving CLS
CLS is the easiest to fix, because the causes are few and well known:
- Images and videos without dimensions. Without
widthandheightin the HTML, the browser reserves no space and content jumps when the media loads. Always declare dimensions or useaspect-ratioin CSS. - Ads, embeds and iframes. Reserve a fixed space for the container before the content arrives.
- Font swapping. The system font is replaced by the web font and the text changes size.
font-display: optionalor metric adjustment withsize-adjustminimise the swap. - Content injected at the top. Cookie banners, notices and bars that appear after load and push everything down. Position them with
position: fixedor reserve the space. - Animations that change layout. Animating
top,heightormargincauses shifts. Animatingtransformandopacitydoes not.
CLS is measured throughout the visit, including scrolling. A page that is stable at load can have poor CLS because of an element that appears mid-read.
How much this weighs in ranking
Core Web Vitals are part of the page experience signals, and Google is explicit that they are a tiebreaker between pages with equivalent content, not a dominant factor. A slow site with the best content still beats a fast site with weak content.
That does not make them irrelevant. Three reasons to take them seriously: in competitive markets, the tiebreaker decides positions; Search and Discover use performance as an eligibility criterion for some features; and the effect on conversion is direct and measurable, regardless of ranking. A store with a 5-second LCP loses sales at any position.
The opposite mistake exists too: spending months optimising vitals on a site that does not rank for lack of content or because of an indexing block. In that case the problem is elsewhere, and it is the first thing an SEO audit should separate.
Checklist by platform
| Platform | Most common cause | Typical fix |
|---|---|---|
| WordPress | Too many plugins, heavy theme, no caching | Page cache, remove redundant plugins, optimise images, lighter theme; review hosting |
| Shopify and other SaaS stores | Apps injecting scripts, feature-heavy themes | Remove unused apps (they leave code behind), trim theme sections, right-sized images |
| React, Vue and Next sites | Heavy hydration, large bundles, high INP | Server rendering, code splitting, partial hydration, less client-side JavaScript |
| Static marketing site | Heavy images, fonts, third-party scripts | Modern formats, font preload, load third parties after interaction |
| Any platform | Tag manager with dozens of tags | Tag audit: each one has to justify its existence |
If the site is going through a redesign, that is the moment to decide these things before building, not to fix them afterwards. That is how we treat technical SEO and website design: speed is a project requirement.